
Water and utilities
Consumption, pressure, losses and quality.
NEXAVIA PLATFORM
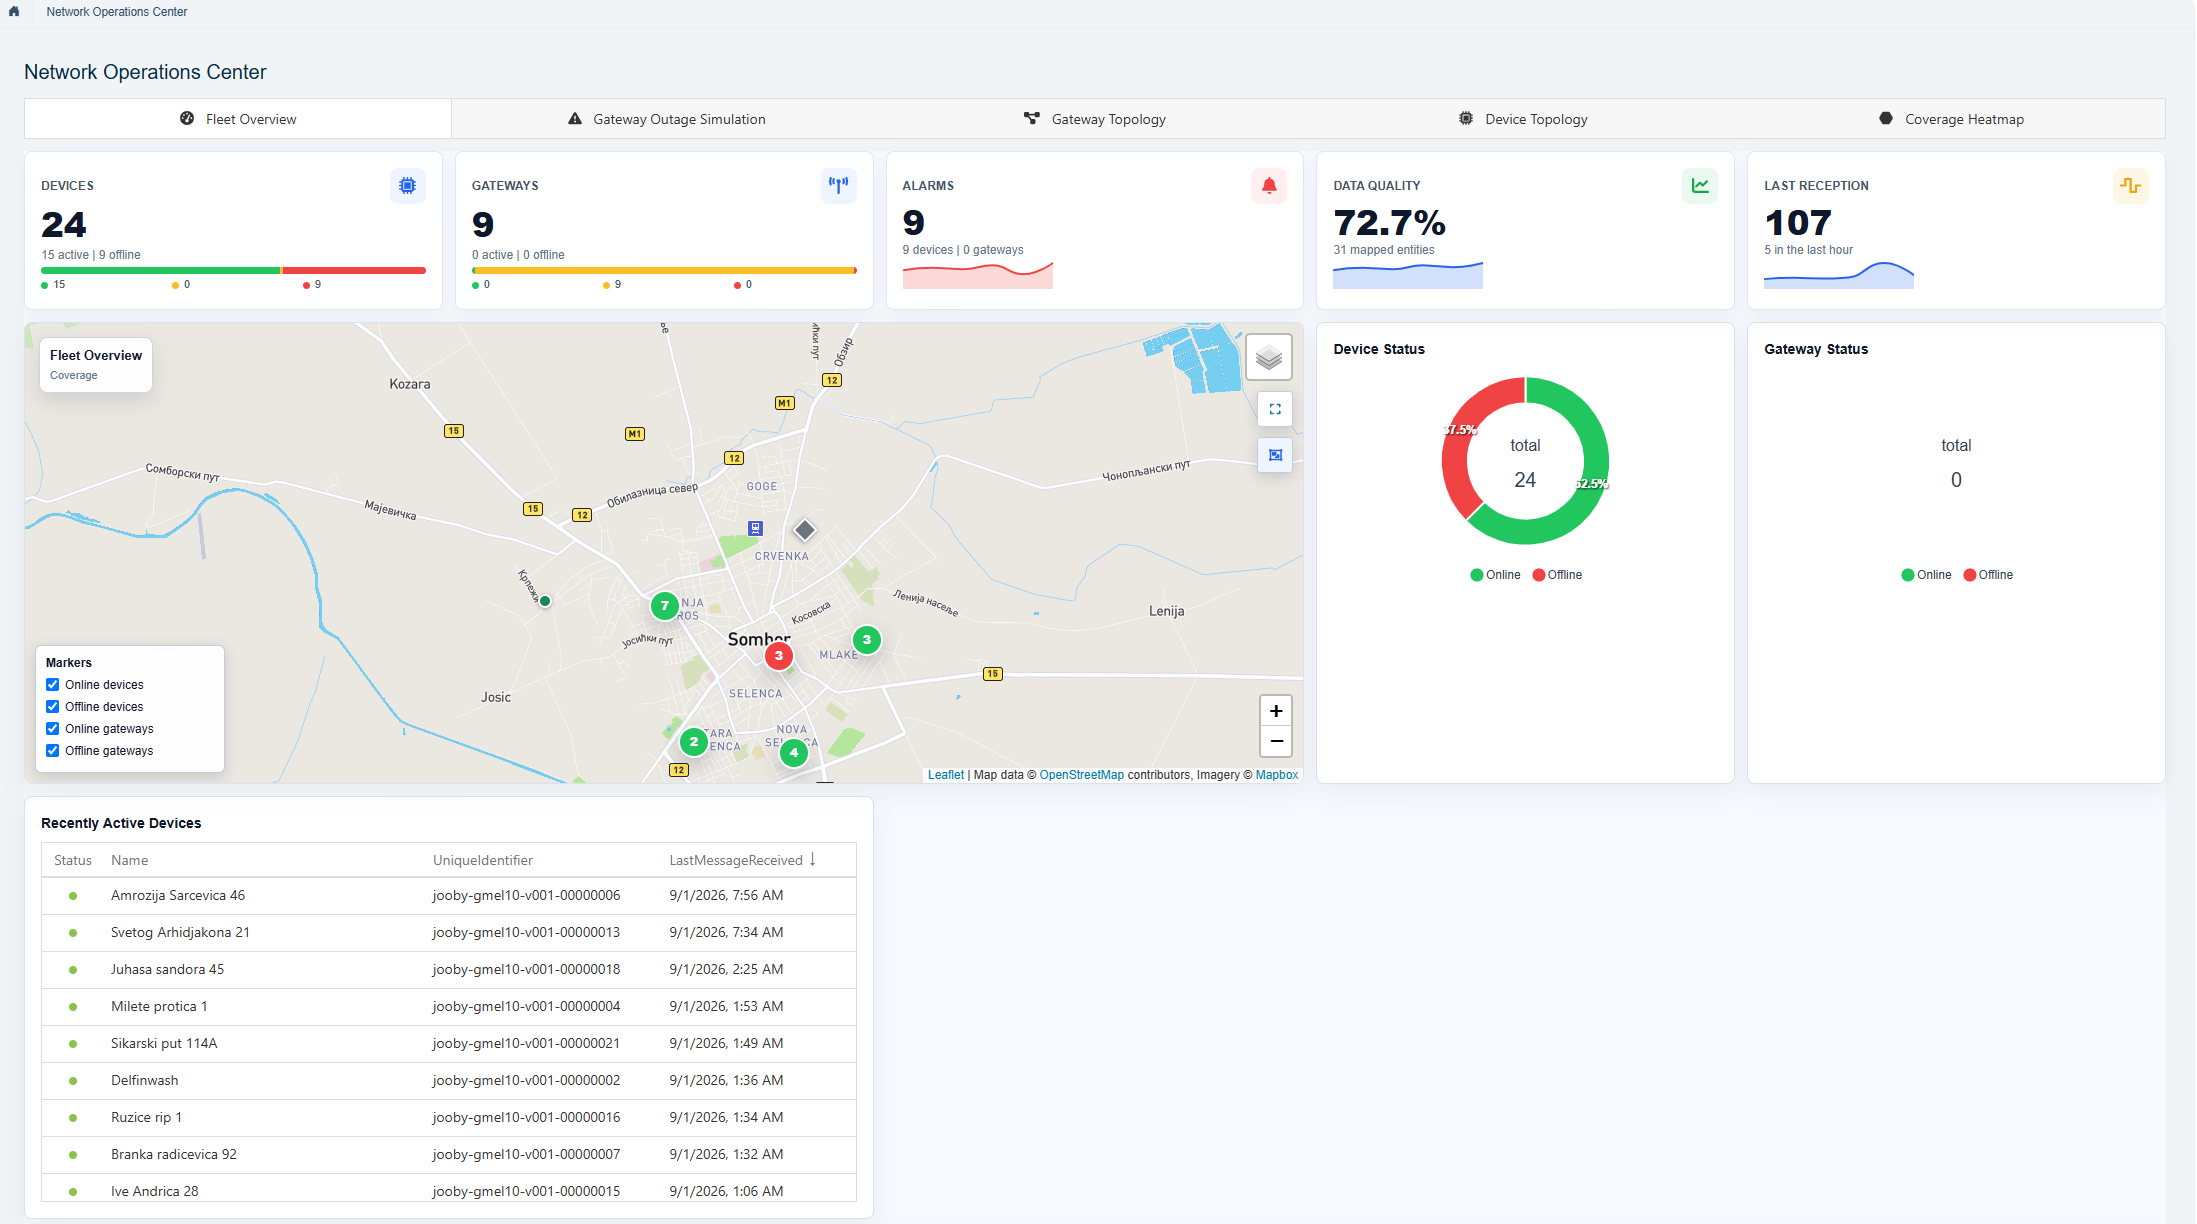
Nexavia combines data from devices, existing systems and external sources and turns it into an overview, an alert and a basis for action.

TRUSTED BY
NEXAVIA IN EVERYDAY WORK
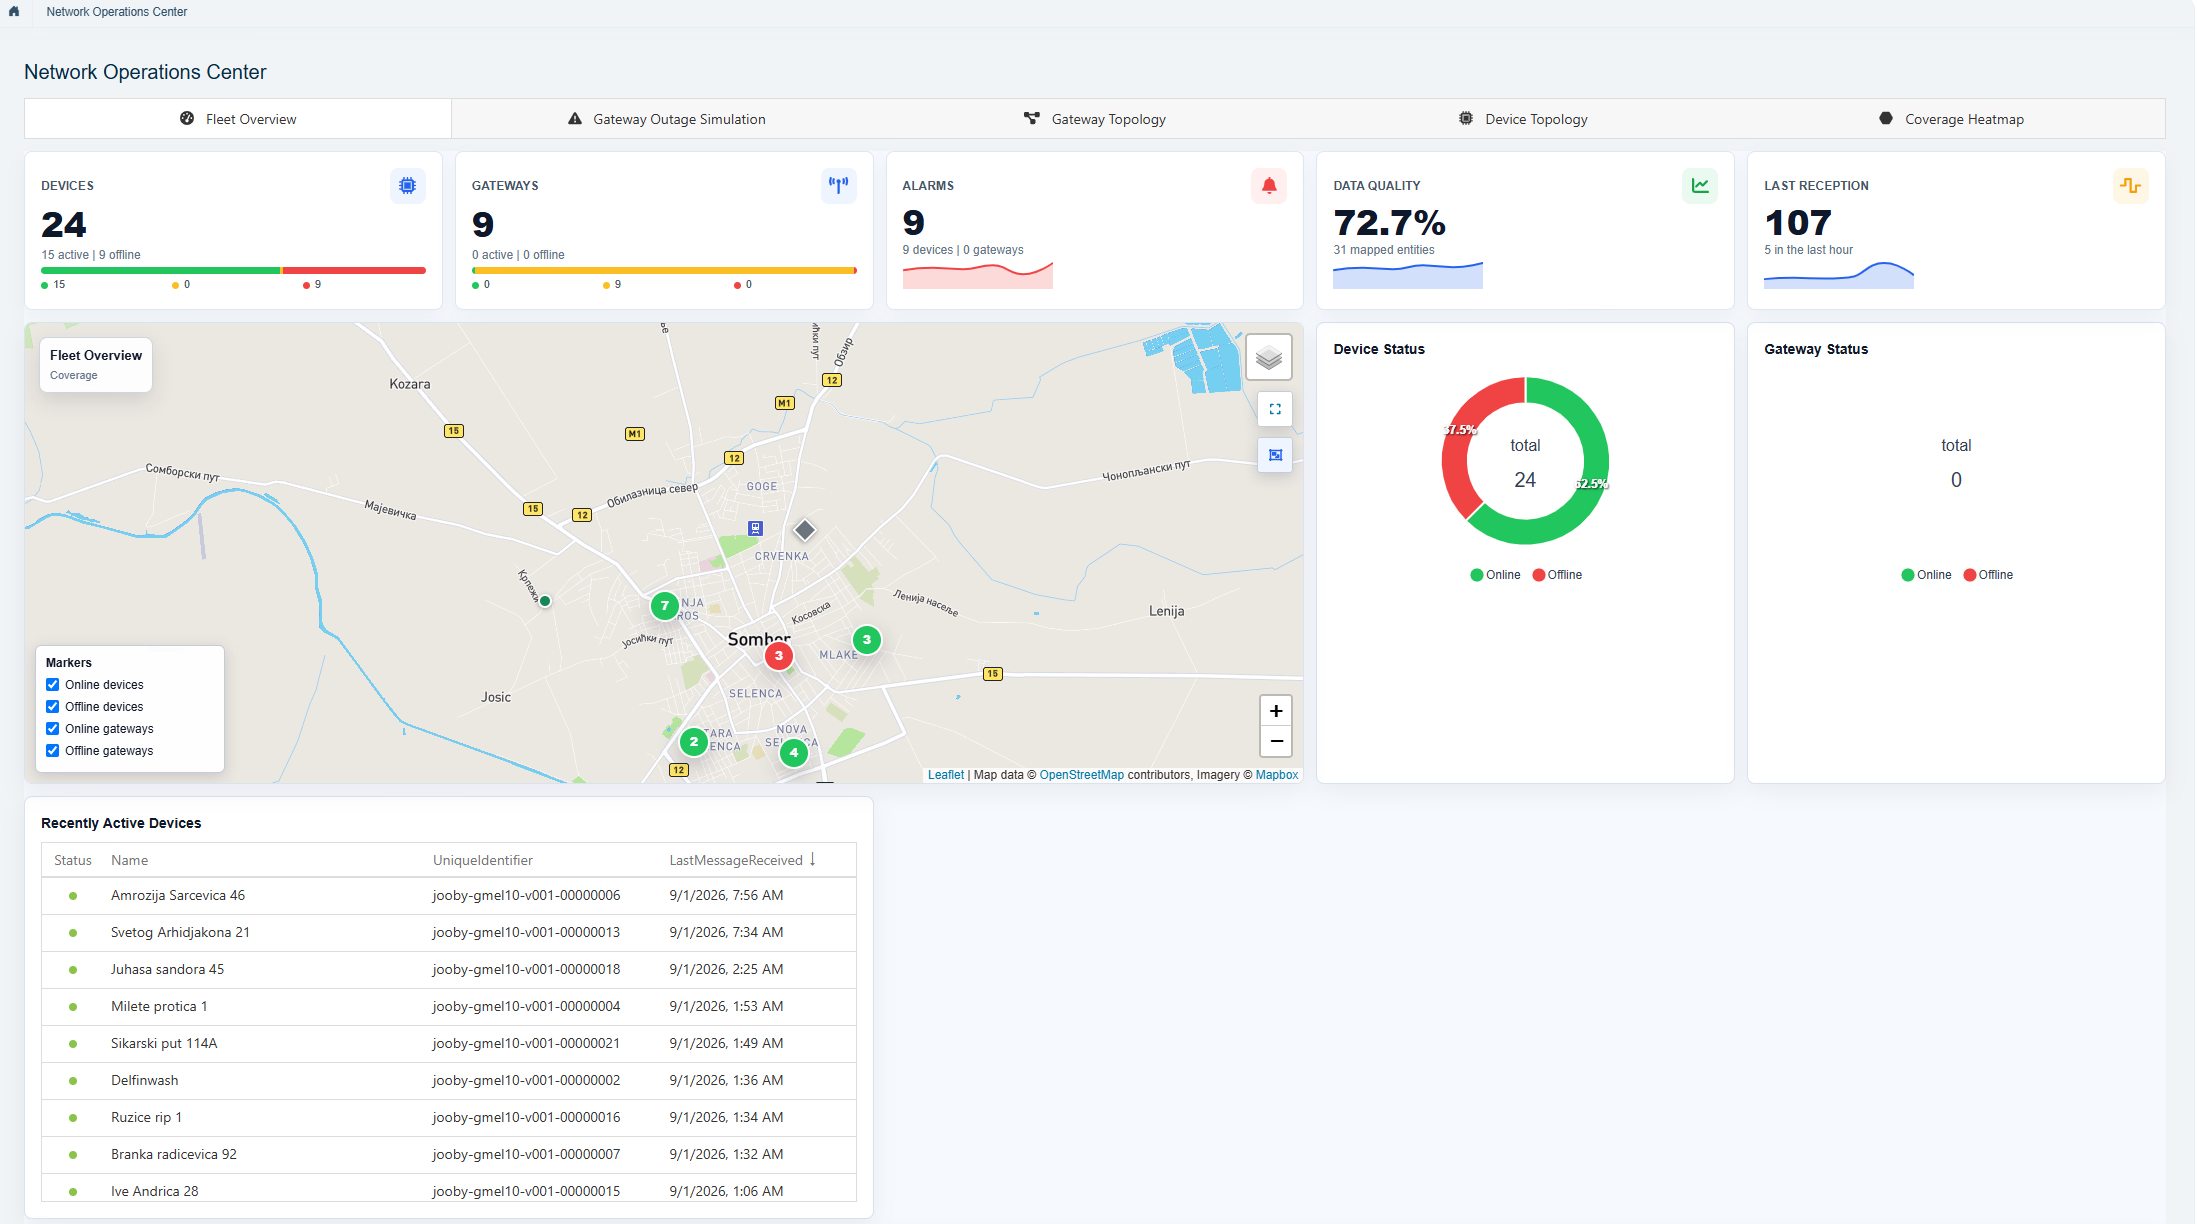
Every user sees the data and tools they need for their work.
Demo data
Demo data
MODULAR PLATFORM
Consumption, pressure, losses and quality.
Consumption, power and deviations.
Air, noise and environmental indicators.
Traffic flows and sustainable mobility.
Status of facilities, devices and maintenance.
SHOWCASE ROOM
Four digital twins connected to a Nexavia dashboard. Switch the lights, follow live sensor readings and watch the rules act on their own.
Open the showcase room →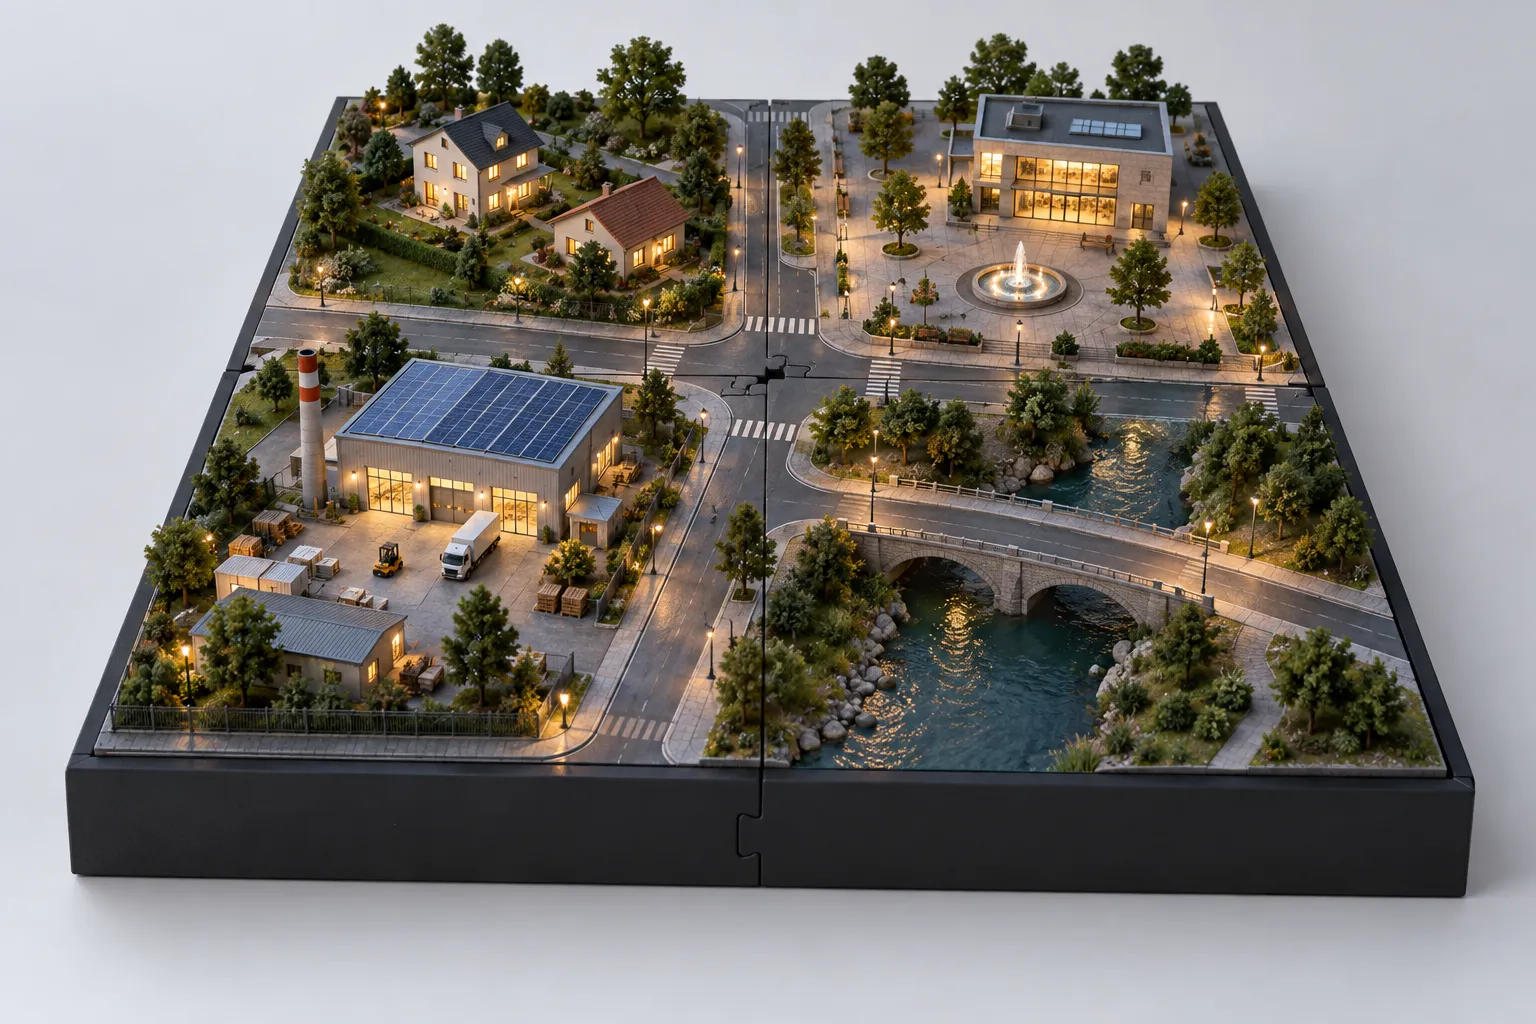 Smart city Lighting, utility meters, and bridge, river, air and cyclist sensors. Open the model →
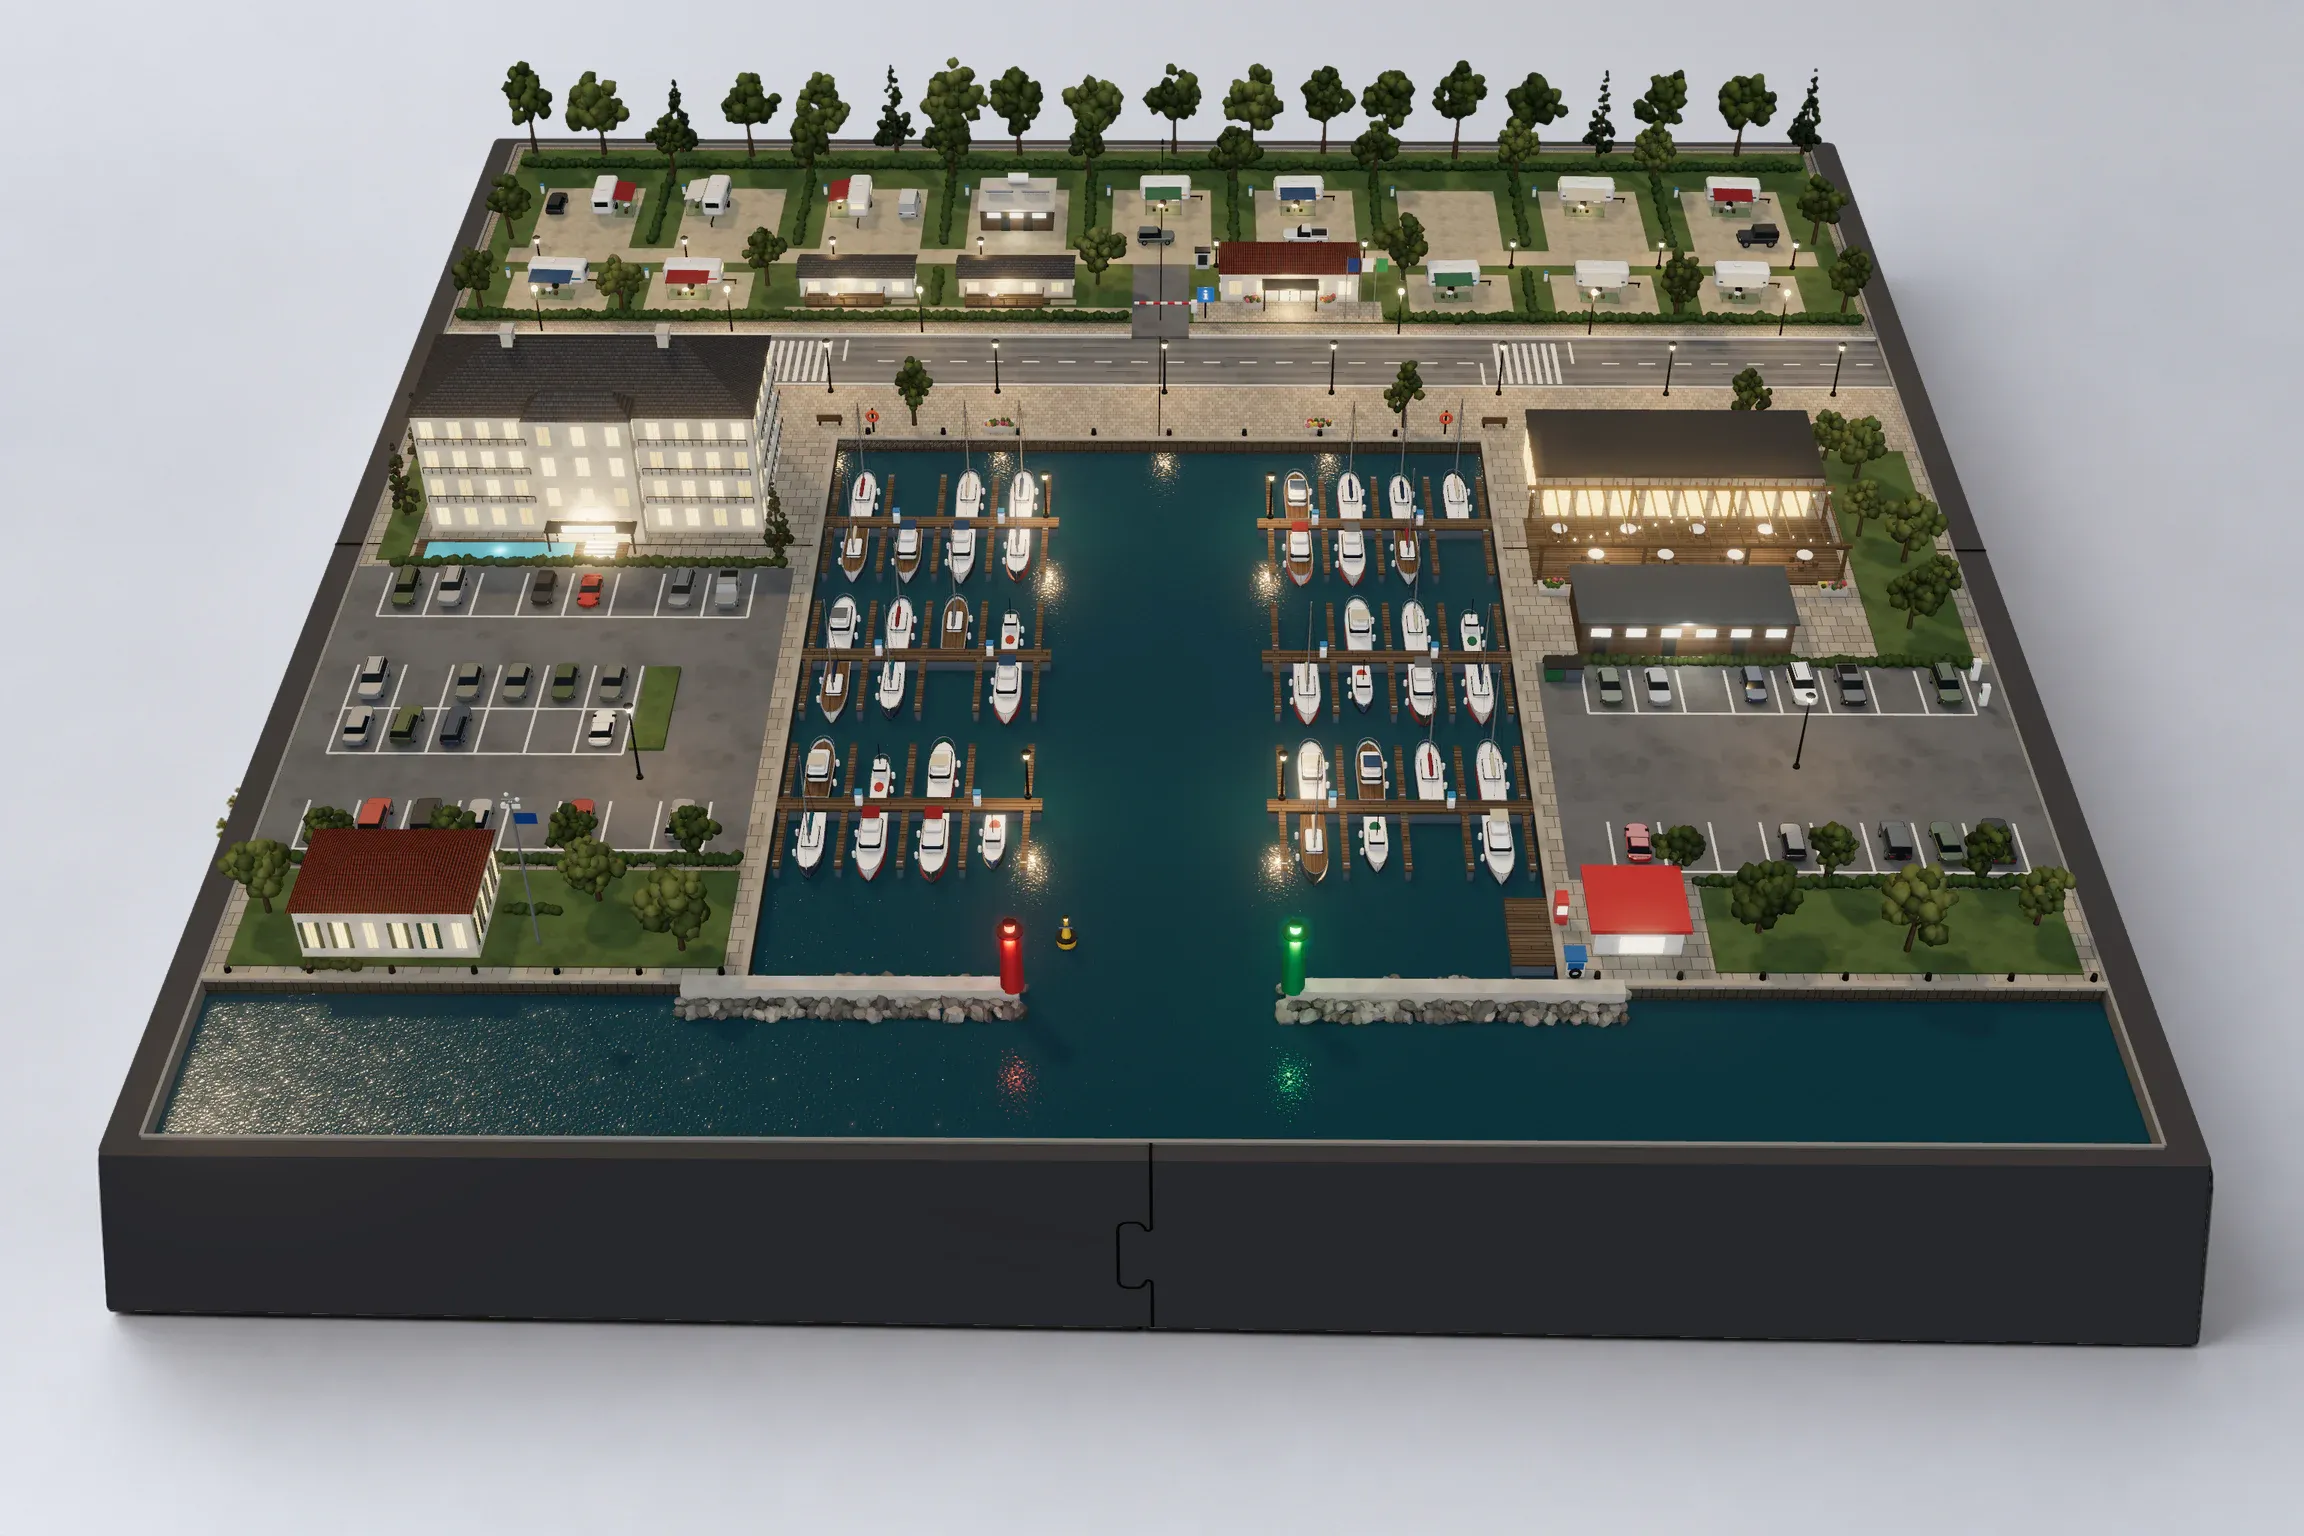 Smart marina and camp Power and water per berth and pitch, NFC cards, PMS check-in and check-out, sea, weather and safety. Open the model →
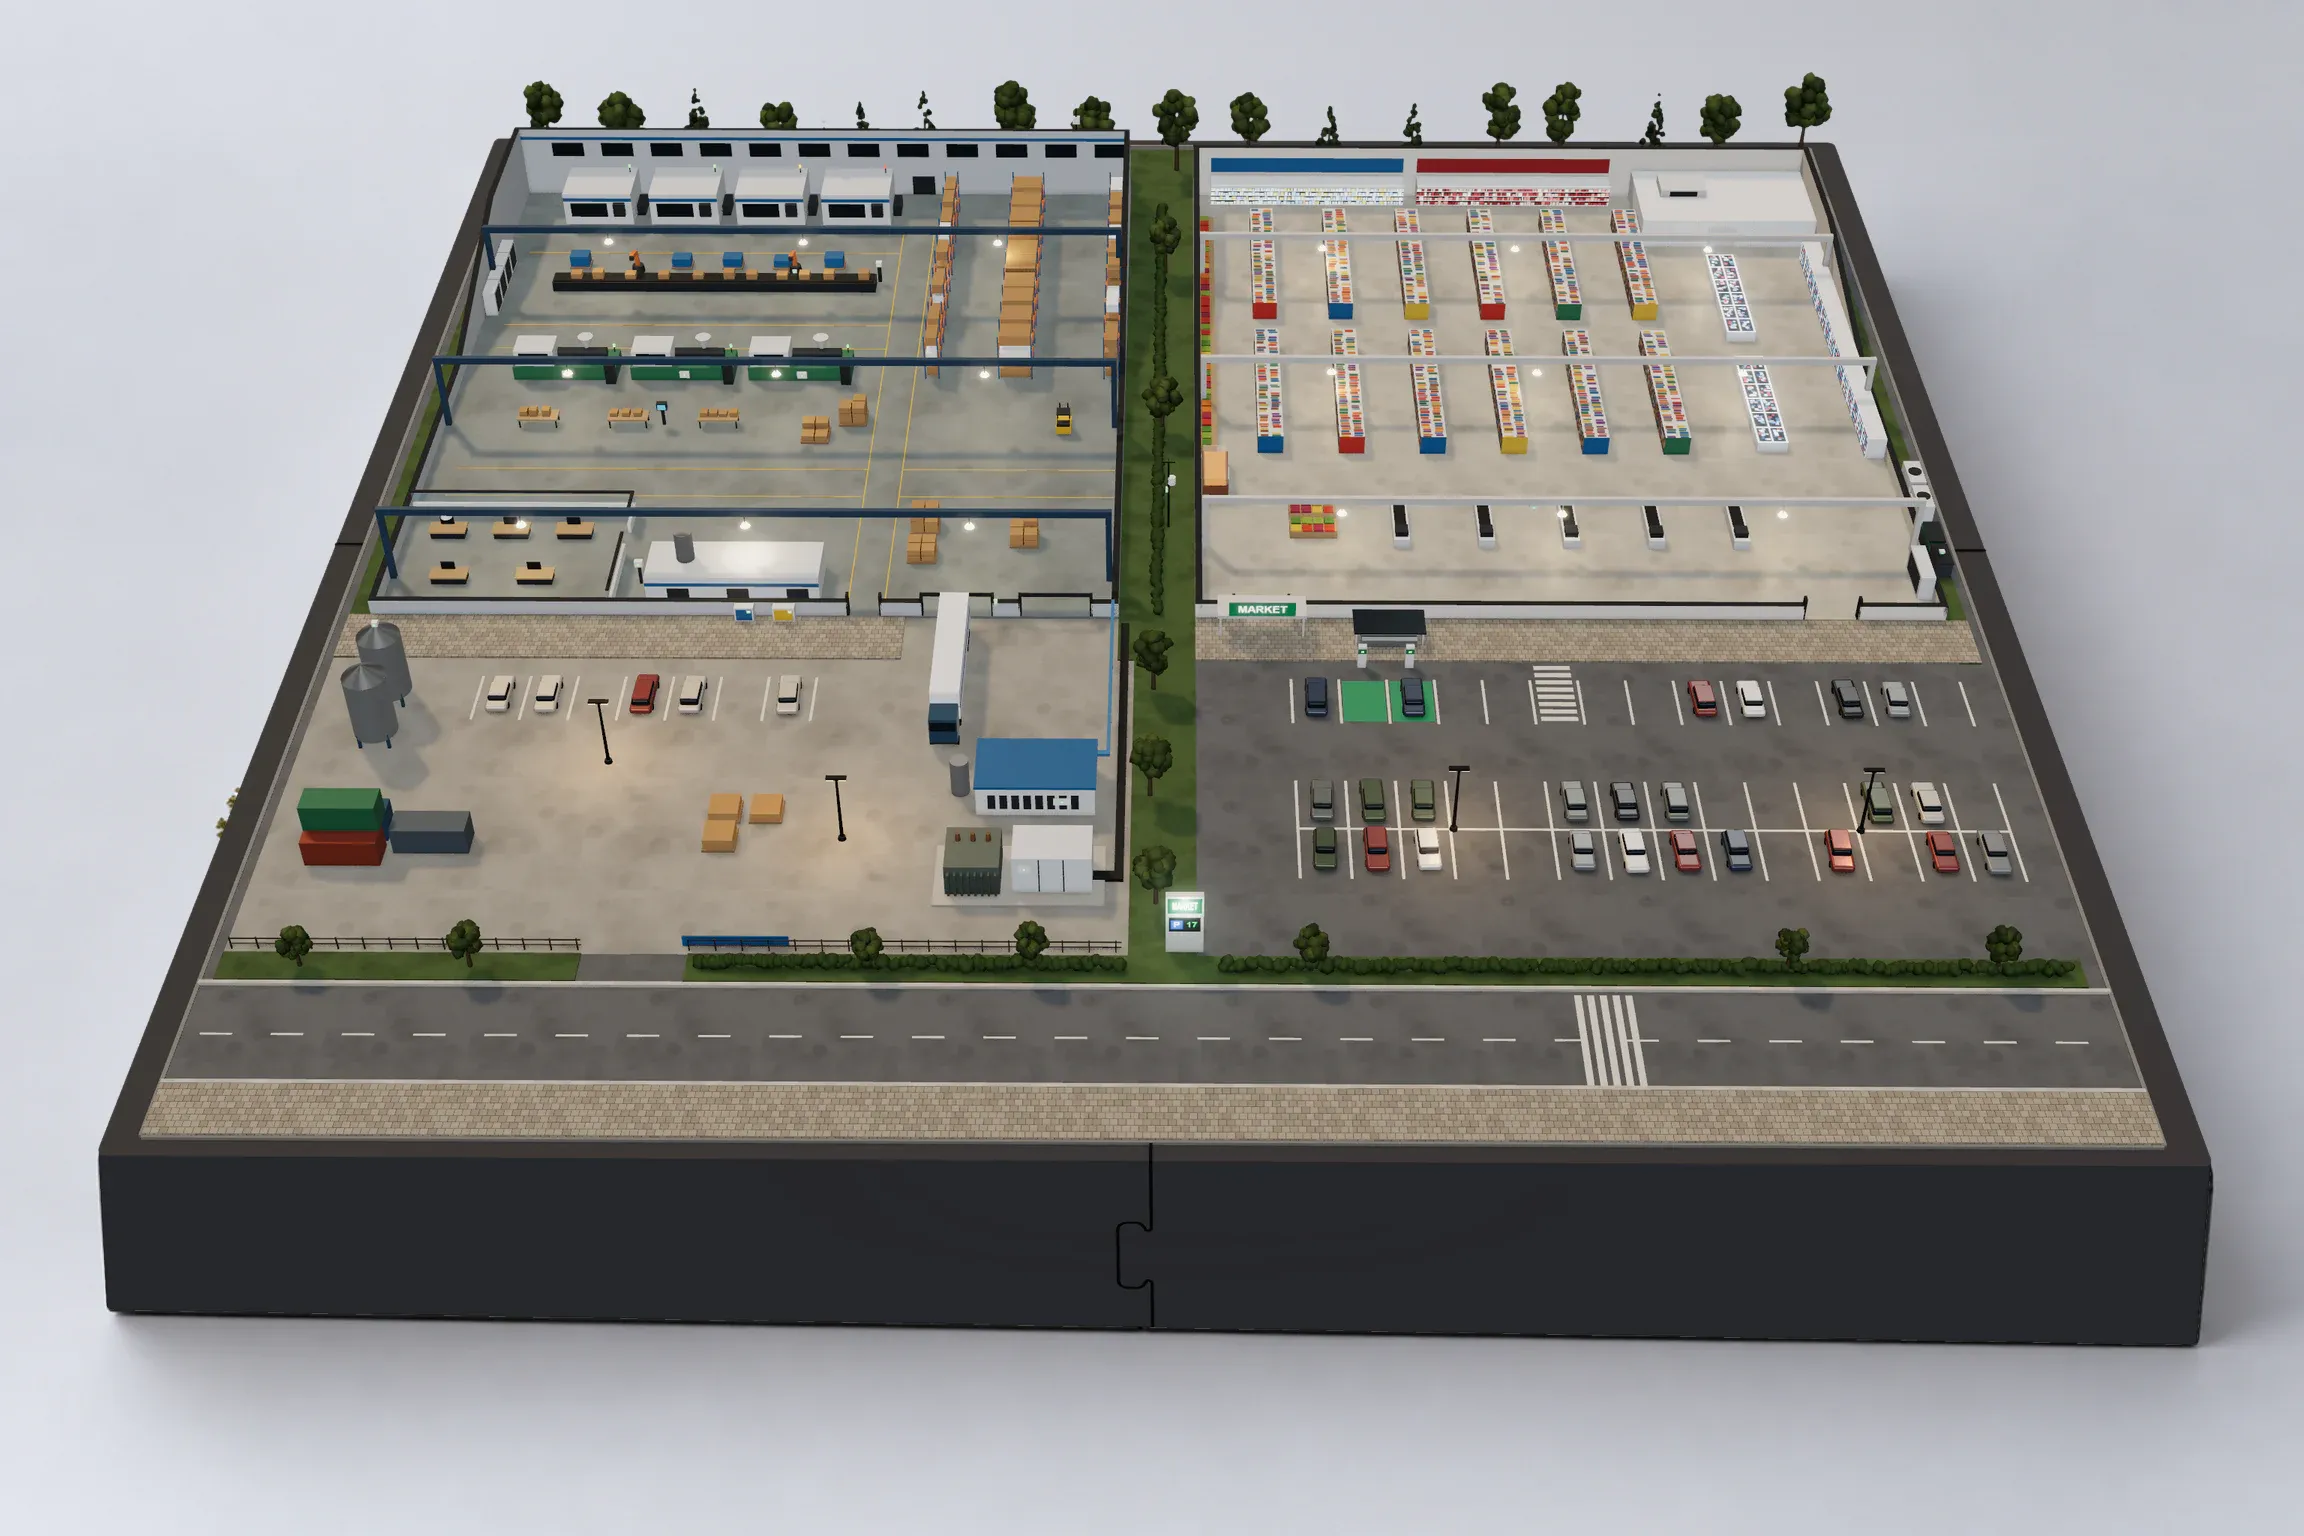 Industry Electricity, air, gas and water to every line, machine OEE with KAI forecasts, and a supermarket's cold chain, shoppers and car park. Open the model →
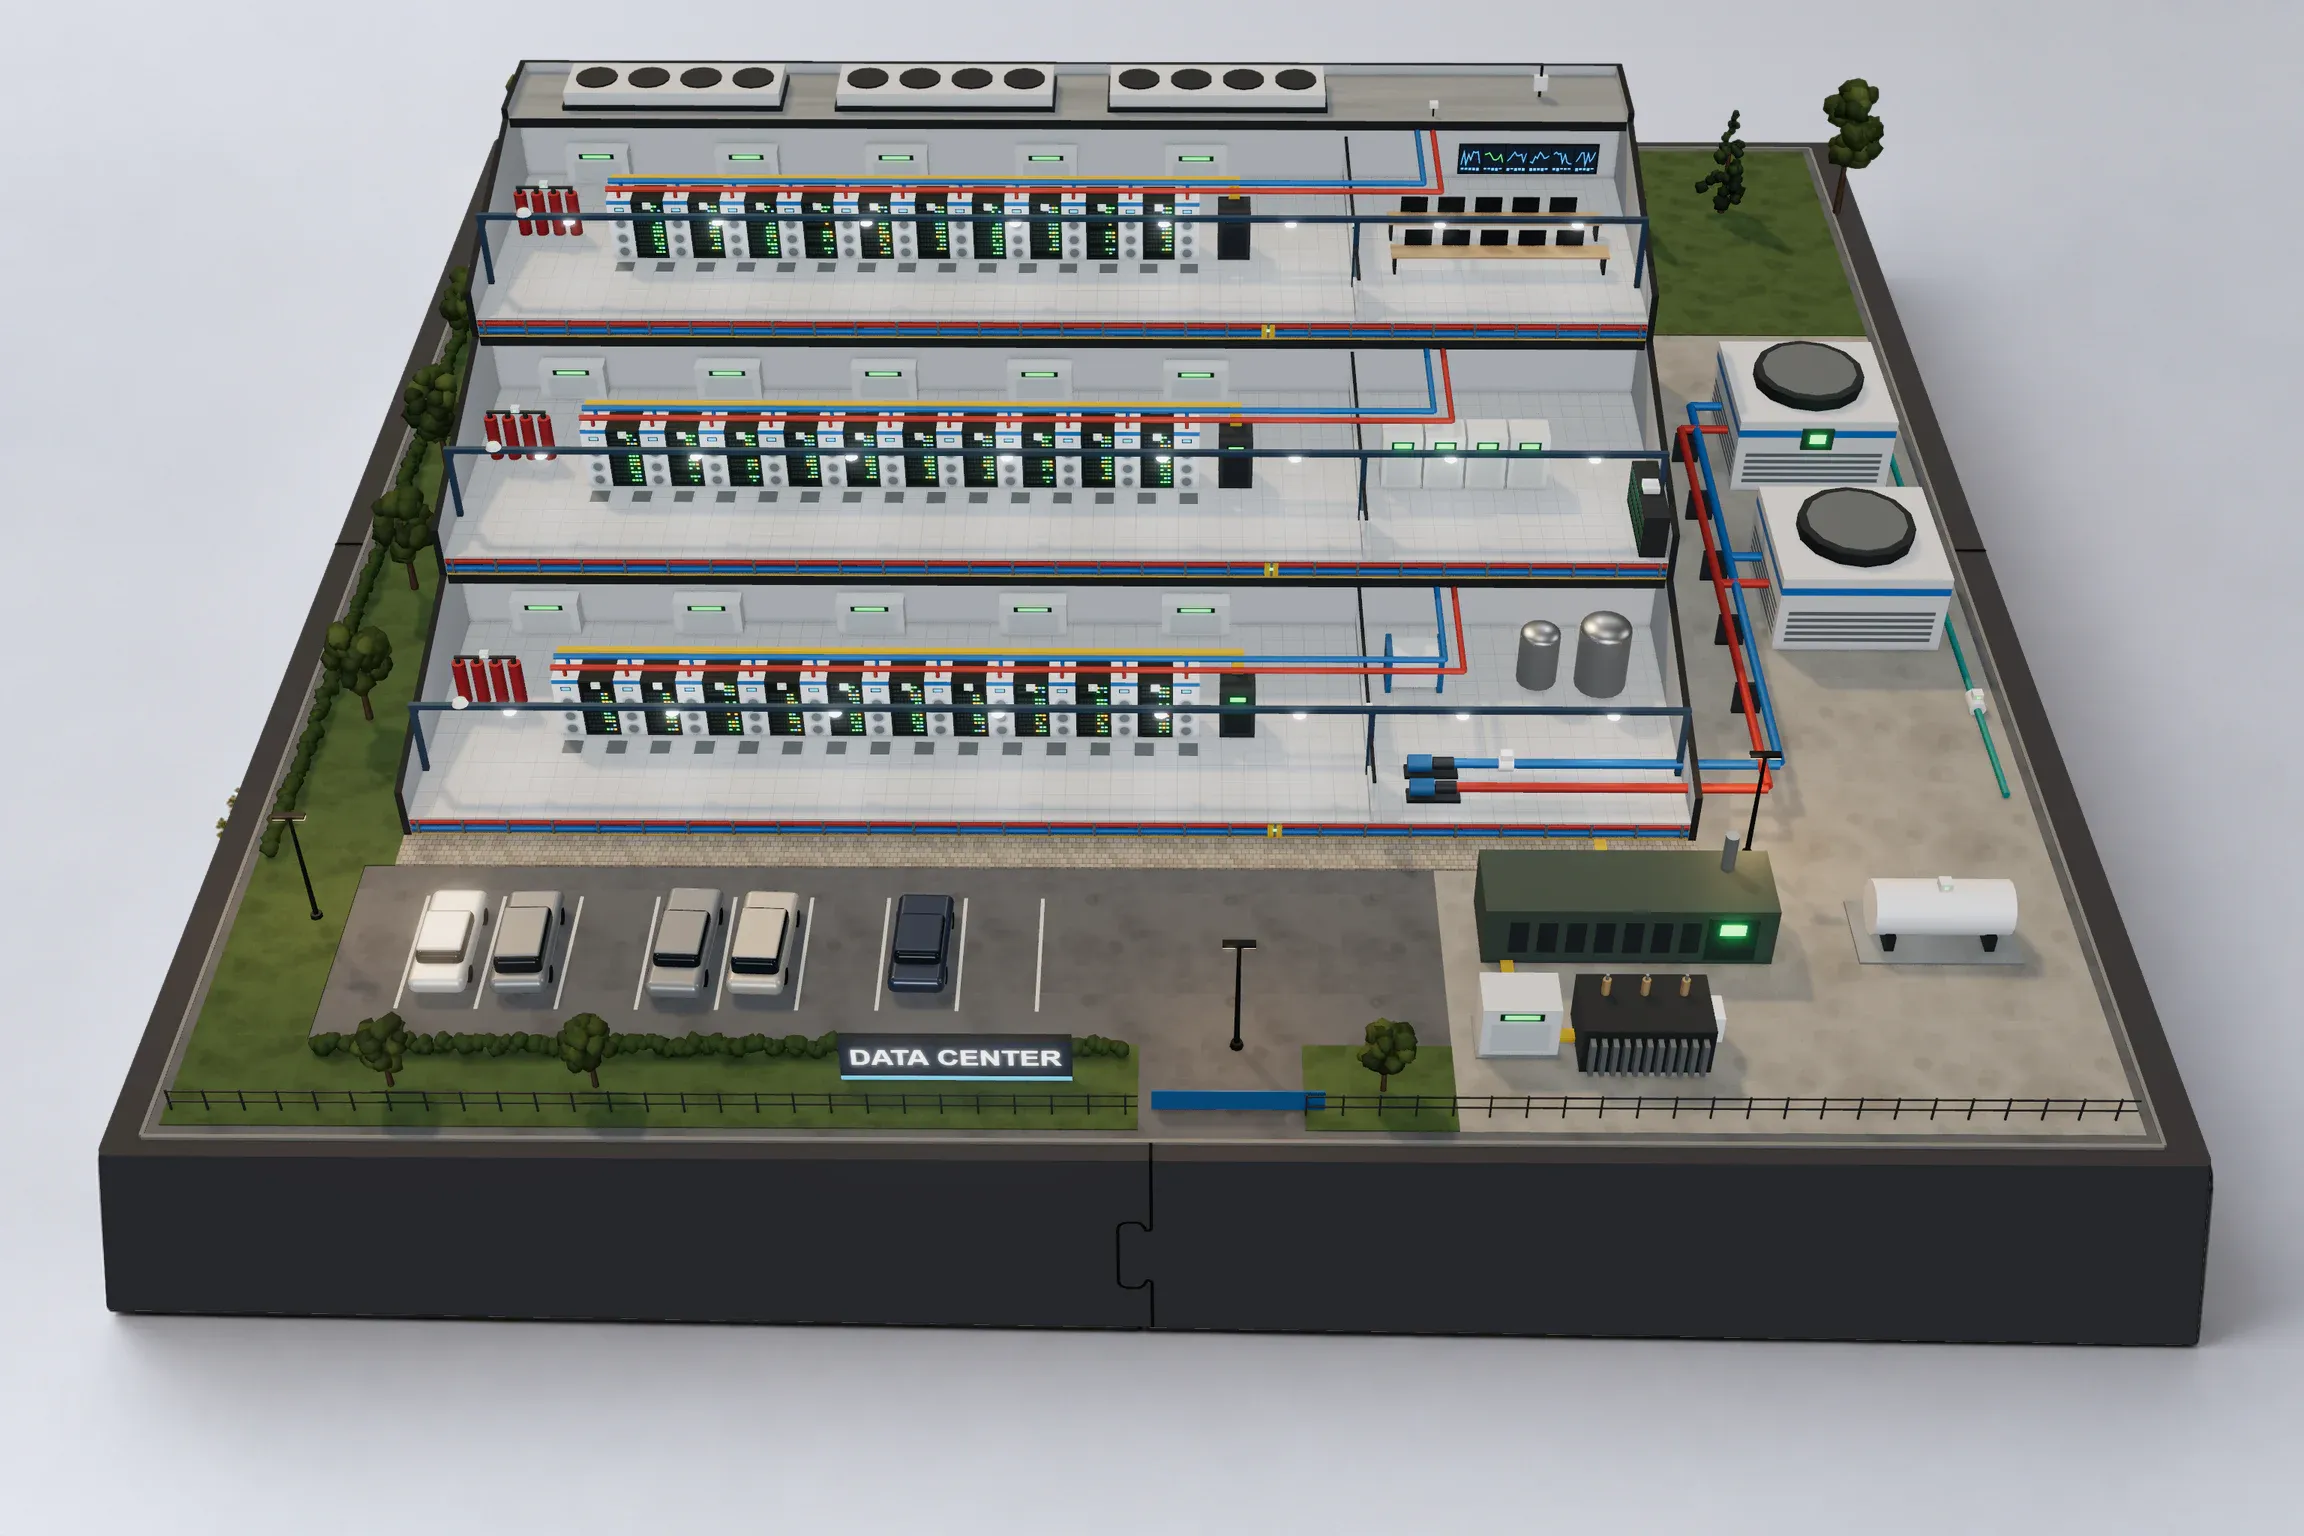 Datacenter Power from the transformer to every rack PDU, cooling, leak and smoke detection on every level, and KAI forecasts. Open the model →
KAI IN NEXAVIA
KAI is designed to analyze Nexavia data first on your own servers. With sufficiently capable hardware, even demanding analysis can stay local. Compatible GPUs can substantially speed up supported analysis. KAI links deviations to clear alerts and context for the next step.
Response speed and quality also depend on KAI's configuration. Most setup work happens during the initial rollout; later adjustments are usually smaller.
External language model services are an option only for the most demanding tasks that exceed local capacity. People remain in control of decisions.
Consumption over time
Check the location and compare the last 7 days.
CONNECTED TO YOUR ENVIRONMENT
Devices, business systems and external sources connect through standard interfaces in one operational view.
Connectivity · processing · rules · unified data model
In a short presentation, we show how the platform could support your specific use case.