
Unified overview
All important data, systems and locations in one place.
Infrastructure and process digitalization
We connect field devices, existing systems and data in the Nexavia platform for clear monitoring, timely alerts and better decisions.
Data connects
better communities


How it works
Nexavia combines data from field devices, measurements and existing information systems. It provides a unified view of infrastructure, faster deviation detection and more effective action.
Existing systems and external sources: ERP · SCADA · GIS · Weather and public data · Other dedicated platforms
Meet NexaviaAll important data, systems and locations in one place.
Deviations and events reach the responsible person in time.
Analytics supports infrastructure management and action planning.
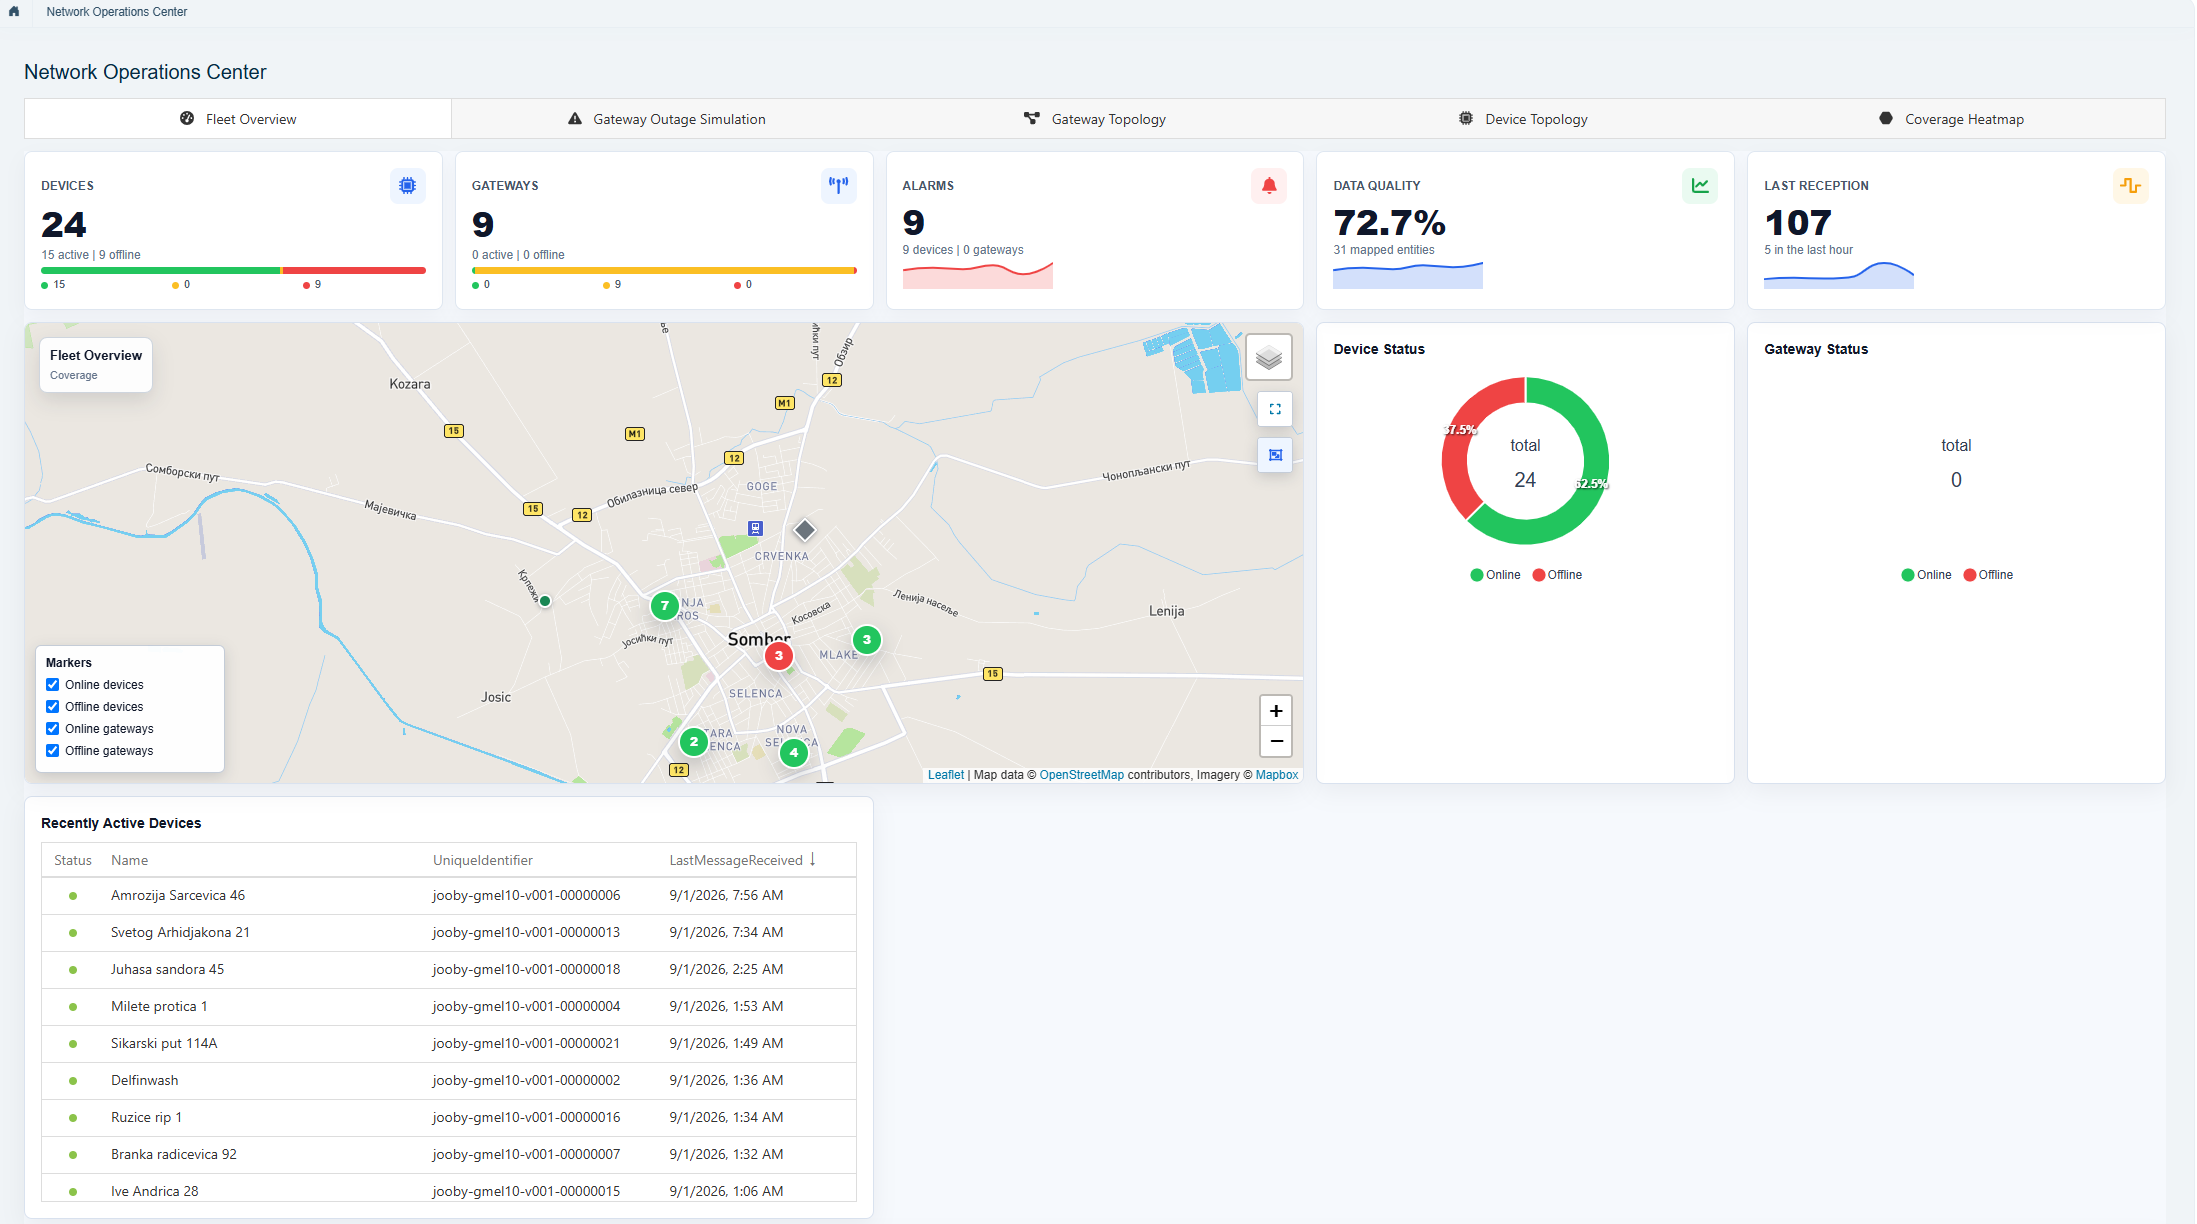 Enlarge view
 Real challenges. Concrete solutions.
Nexavia detects the deviation and alerts the responsible person.
Explore the solutionThe system compares consumption over time and highlights unusual changes.
Explore the solutionData from several sources is displayed on a usage map and supports infrastructure planning.
Explore the solutionSolutions for municipalities, utilities and industry
Monitoring networks, consumption, losses, pressure and quality.
Reference BrezovicaMonitoring energy efficiency and unusual deviations.
Reference Adria MobilMeasuring emissions, air quality, environmental indicators and noise.
Reference GradiškaMonitoring traffic flows and supporting sustainable mobility planning.
Reference Novo mestoOverview of distributed facilities, devices and maintenance.
Reference KrkKAI · Nexavia analytics layer
KAI is designed to prioritize processing on your own servers. With enough processing power and memory, even demanding analysis can stay local. Compatible GPUs can substantially speed up supported tasks. KAI helps detect deviations, explain events and prepare the next step.
Response speed and quality also depend on KAI's configuration. Most setup work happens during the initial rollout; later adjustments are usually smaller.
External language model services are an option only for the most demanding tasks that exceed local capacity. People remain in control of decisions.
More about KAIDeviation-detection example
Alert
Consumption deviates from the usual pattern. Check the metering point and network status.
How detection worksThere is no need to digitalize everything at once. We select a use case, connect the available data and first validate the solution on a limited scale.